The Crude Oil Price Peeked in 2008 but how Expensive is it now in World Currencies
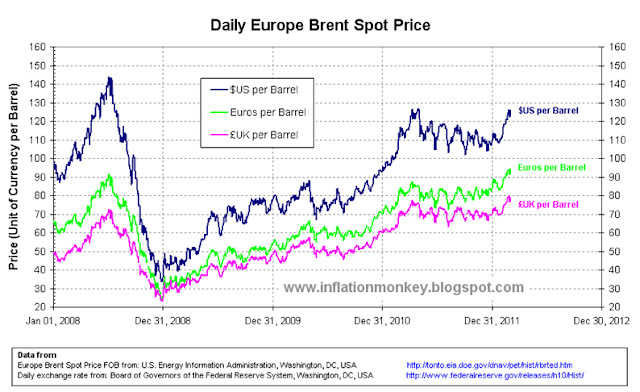
Just recently there has been a lot of talk about the price, plus the increasing price of petrol and diesel (which our US brethren refer to as "gas"). So I thought that I’ll look at the crude oil price over the last couple of years. There are many benchmarks for the crude oil price, such as the West Texas Intermediate (WTI) and Dubai Crude, but I’m going to use the Brent Crude spot price. The nominal Brent Crude oil price peaked on 3rd July 2008 at $143.95 (US Dollars) per barrel, before rapidly falling during the “credit crunch“ after the collapse of the US Investment bank Lehman Brothers Holdings Inc. The nominal Brent Crude price bottomed on 26th December 2008 at $33.73 per barrel. Since that time the prices have increased and by the 1st March 2012 the price was $125.76 per barrel, which is 87% of the peak price on 3rd July 2008. However unless you live in the US, buy all your goods and get paid in US Dollars, the Dollar price of crude oil doesn’t mean much as your reference will be another currency. So I’ve converted the crude oil price since 2008 to determine the price in several world currencies. The Brent Crude Oil price since 2008 in US Dollars, UK Pounds and Euros is shown in the chart below. |
| Daily Brent Crude Oil Price since 2008 in US Dollars, Pounds Sterling and Euros per Barrel. |
The data for the historic daily Brent Crude Oil spot price
since 2008 came from the US Energy Information Administration, the and the daily international exchange rates forUS Dollars came from the Board of Governors of the Federal Reserve System, Washington, DC.
From the chart above you can see that the oil
price in UK Pounds and Euros (EUR) at the time of the peak on 3rd July 2008
were £72.61 and EUR 91.64 per barrel respectively. Furthermore their receptive price on 1st March
2012 was £78.83 and EUR 94.41. As it can be seen these
vales are higher than those see at the peak price on 3rd July 2008. Normalizing the crude oil
priced in the different world currencies by indexing the prices to the value on
3rd July 2008 (i.e. by making the value on that date = 100) highlights the
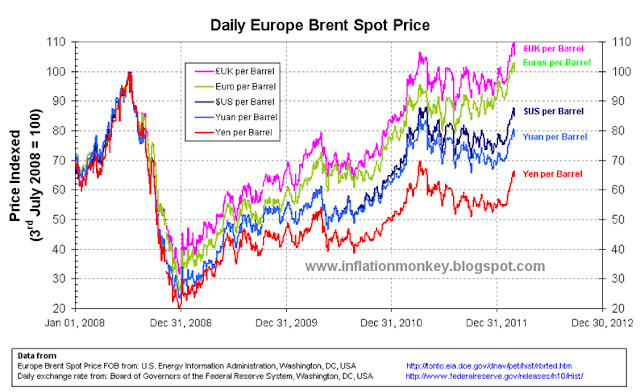
comparative price changes between those currencies over time. The chart below shoes the index daily Brent
Crude Oil price since 2008 in US Dollars, GB Pounds, Euros, Japanese Yen and Chinese Yuan. Its interesting
to note that compared to the 2008 peak price, the oil price at the beginning
of March 2012 in Chinese Yuan and Japanese Yen is approximately 78% and 65% respectively. Compare this to approximately 85% for the
price in US Dollars, quite a difference!
 |
| Daily Brent Crude Oil Price since 2008 - Indexed to 3 July 2008 - in US Dollars, Pounds Sterling, Euros, Japanese Yen and Chinese Yuan per Barrel. |
From the chart above you can
clearly see that the crude oil priced in Pounds Sterling and Euro were by the
begging of March 2008, higher than at the July 2008 peak (by 8% and
3% respectively). Below is the same index
chart of the Daily Brent Oil Price but for a set of emerging market currencies
(Indian Rupees, Brazilian Reals, Thai Baht and Japanese Yen).
 |
| Daily Brent Crude Oil Price since 2008 - Indexed to 3 July 2008 - in US Dollars, Japanese Yen, Indian Rupees, Brazilian Reals, Thai Baht per Barrel . |
The worrying thing for the UK and Euro Zone is that the crude oil price has
been constantly high (at closet to 100% for the UK and 90% for the Euro Zone) compared
to the 2008 peak oil price since the beginning of 2011. For the rest of the world oil prices started high at the beginning of 2011 and then fell back. It was only since February 2012 for some of the other world currencies that the oil
prices started to rise to relatively high prices seen at the 2008 peak (examples are the Indian Rupee and US Dollar).
Below is a table displaying the Brent Crude Oil
Price in a number of world currencies at the July 2008 peek, at the beginning
of March 2012 and the index price at the beginning of March 2012. The
currencies have been ordered such that the one with the heights indexed oil
price is first and the lowest is last.
The US Dollar row is highlighted by being bold to illustrates in which
currencies the oil price index are larger or lower compared to the US Dollar
price.
Table of Brent Crude Oil Price per Barrel in a Number of World Currencies
Currency
|
Brent Oil Price on 3rd July 2008
|
Brent Oil Price on 1st March 2012
|
Index Price on 1 March 2012 (3rd July 2008 = 100)
|
72.61
|
78.83
|
108.6
|
|
91.64
|
94.41
|
103.0
|
|
6,214.32
|
6,179.85
|
99.4
|
|
861.92
|
832.61
|
96.6
|
|
733.53
|
701.74
|
95.7
|
|
150,355.00
|
140,348.00
|
93.3
|
|
231.20
|
215.15
|
93.1
|
|
143.95
|
125.76
|
87.4
|
|
1,122.49
|
975.28
|
86.9
|
|
1,109.85
|
938.80
|
84.6
|
|
4,380.00
|
3,693.00
|
84.3
|
|
470.00
|
377.28
|
80.3
|
|
986.47
|
792.30
|
80.3
|
|
4,799.29
|
3,835.68
|
79.9
|
|
149.89
|
116.41
|
77.7
|
|
147.88
|
113.83
|
77.0
|
|
196.18
|
139.45
|
71.1
|
|
15,372.0
|
10,206.00
|
66.4
|
As it can been seen that there is
a very wide variation in the crude oil prices in local currencies and the
relative change to those prices since the peak price in July 2008. Taking the price on 3rd July 2008 as the
reference point, in Pounds Sterling and Euros the crude oil price was larger by the beginning
of March 2012 than it was on the reference date, by 8.6 and 3%
respectively. For all the other
currencies the price is still lower, even thought it is only just for Indian
Rupees. For the majority of currencies
the oil prices is around 80-90% of the 2008 peak prices, like the US
Dollar. However there are a few
currencies where the oil prices is less than 80% of the 2008 peak prices
(Australian Dollar, Swiss Franc, Singaporean Dollar and Japanese Yen). Nevertheless the currency in which the crude
oil prices is the lowest compared to the 2008 peak is the Japanese Yen
and it the lowest by quite a margin!
The troubling thing for the UK and Euro Zone is that the crude oil price has
been constantly high (at closet to 100% for the UK and 90% for the Euro Zone)
compared to the 2008 peak, since the beginning of 2011. This is not a good sign as it highlights
external stresses being placed on their economies from high energy prices in
their local currencies. On the other
hand the Japanese and to a lesser extent Singaporean, Swiss and Australian
economies wont be suffering the same external stress from high local energy
prices (although they are likely to suffer from other things instead).
So it would seem that
compared to the peak crude oil prices seen in July 2008, oil is cheapest priced
in Japanese Yen and the most expensive priced in Pounds Sterling.
Written by Inflation Monkey. Join on Google+
Written by Inflation Monkey. Join on Google+


