Lithium Price still cheaper then in the 1980s and 1990s - Just
Lithium and its compounds have several industrial applications, including heat-resistant glass and ceramics, high strength-to-weight alloys used in aircraft, lithium batteries and lithium-ion batteries. The end-use markets for Lithium and its compounds are estimated to be: ceramics and glass, 31%; batteries, 23%; lubricating greases, 9%; air treatment, 6%; primary aluminium production, 6%; continuous casting, 4%; rubber and thermoplastics, 4%; pharmaceuticals, 2%; and other uses, 15% (Ref: US Geological Survey, Mineral Commodity Summaries 2011). With the ever increasing use and demand for high performance lithium and lithium-ion batteries, in a range of applications from laptops and mobile phones to electric cars, this is a very important element to examine.
The estimated annual average lithium price data came from the US Geological Survey. The US Geological Survey used lithium carbonate as a proxy to estimate the price for lithium, as lithium carbonate is a good estimator of its price due to the large quantity and importance of this compound compared to other lithium compounds.
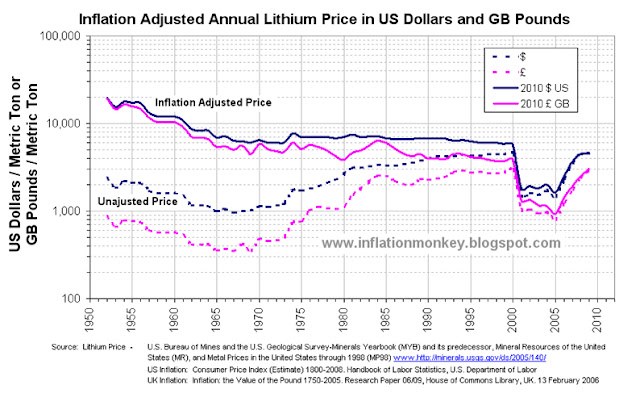
The historical UK Pound to US Dollar exchange rate data came from Lawrence H. Officer, "Dollar-Pound Exchange Rate From 1791," MeasuringWorth, 2011 at www.measuringworth.com. The prices were adjusted for inflation by converting the nominal price into the equivalent in 2010 US Dollars and 2010 GP Pounds Stirling. The US inflation data came from the historical CPI from the US Department of Labor. For the UK inflation the data came from Dominic Webb (2006) "Inflation: the Value of the Pound 1750-2005" Economic Policy and Statistics Section, Research Paper 06/09, House of Commons Library, UK. From this you get the following results shown in the graph below.
 |
| Historical Annual Average and Inflation Adjusted Lithium Carbonate Price since 1952 in US Dollars and UK Pounds |
The doted lines are the unadjusted nominal annual average lithium carbonate price, and the sold lines are the inflation adjusted lithium carbonate price. The first thing that becomes obvious is that the unadjusted lithium carbonate piece bottomed in the mid to late 1960s, in both UK Pounds and US Dollars at around £350 and $970 per metric ton respectively.
However when you examine the inflation adjusted lithium carbonate price you observe that it crashed in 2000 a reached an all-time low in 2005 in both GB Pounds and US Dollars at around £930 and $1,30 per metric ton respectively. Since them the price has risen by 2009 to approximately £3,000 and $4,600 per metric ton respectively. This trend can be observed more easily in the chart below, which shows only the inflation adjusted lithium carbonate price.
 |
| Inflation Adjusted Lithium Carbonate Price since 1952 in US Dollars and Pounds Sterling |
The second thing that you observe is that the US Dollar price of lithium carbonate was approximately constant from 1975 till the mid 1980s. Using the stability in the price as a baseline the inflation adjusted lithium carbonate price in UK Pounds and US Dollars were indexed from price in 1975 and this is shown below.
 |
| Historical Inflation Adjusted Lithium Carbonate Price since 1952 in US Dollars and GB Pounds, Indexed to 1975 |
It is also interesting to note the compounded rate of change for the inflation adjusted lithium carbonate prices index in US Dollars and GB Pounds, tracked each other pretty closely. Although there is much greater volatility in the price in UK Pounds due to the exchange rate volatility in the late 1970s and early 1980s.
The indexed price data clearly displays that since the late 1960s the inflation adjusted lithium carbonate prices has been pretty constant until the crash in 2000. The price only dropped to approximately 25% of the late 1970s and early 1980s price. Additionally the rapid price rise since 2006 has taken the price to about 65% of that in the late 1970s and early 1980s. So from a historical perspective the 2009 is significantly off the inflation adjusted prices of the early 1960s and before and the relatively stable price from 1970s till 2000.
Written by Inflation Monkey. Join on Google+.

